


What if you could earn thousands of backlinks without paying for them?
Over the past two years, we earned more than 4,700 organic backlinks from 1,000+ unique domains for Tenet, our parent company’s website. And we did it without spending a single dollar on link buying.
Based on the cost of similar paid placements, these links would have cost us at least $50,000 to acquire through sponsored posts and link vendors.
So, how did we do it?
We focused on one type of content: statistical roundup articles. These pages bring together useful data from original research, government reports, and trusted sources. Writers and bloggers can use these statistics to support their own articles, often linking back to us as the source.
The results speak for themselves. Our statistics pages have earned citations from websites such as Infosys, IBM, Zoho, MSN, Forbes, HubSpot, and Mangools.
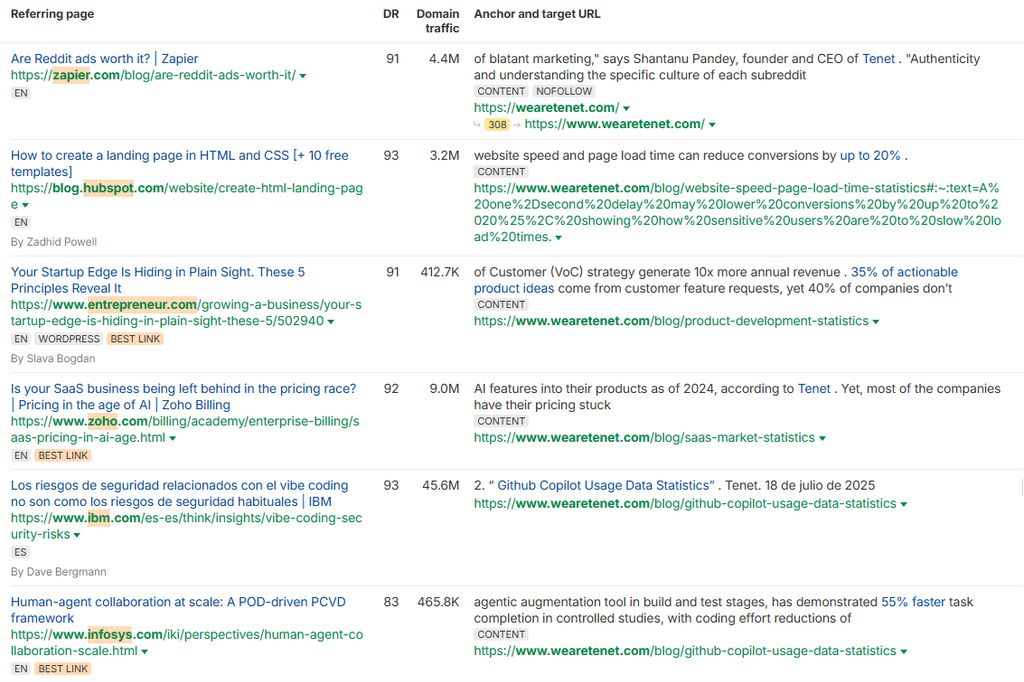
In fact, we still earn 20+ high quality editorial backlinks every month without reaching out to websites for every link.
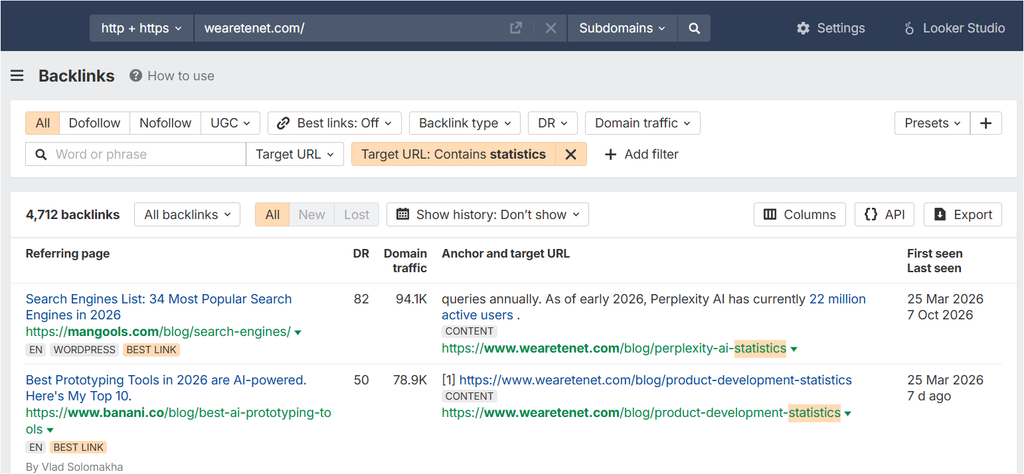
Our Ahrefs dashboard shows 4,712 backlinks pointing to Tenet’s statistics pages, including a DR 82 link from Mangools.
In this article, we will walk you through the exact 9-step process we used to build this system.
You will learn how to find the right topics, research and verify statistics, structure your articles, and keep them useful over time so they can continue attracting backlinks.
Why we stopped relying on paid link building
Traditional link building often depends on individual placements. You identify a website, contact its editor, negotiate a fee or placement, and repeat the process for the next link.
This approach can produce links, but it requires ongoing effort and spending. When you stop funding the campaign, you may also stop acquiring new links.
We wanted to build a system that could continue earning backlinks after publication.
Statistical articles offered a practical solution because writers need evidence to support their claims. A blogger writing about website performance may need data on page speed. A journalist covering AI adoption may need recent usage figures. A marketing writer discussing branding may need research on brand recognition or customer behavior.
These writers often search for statistics before publishing their articles. If your page contains relevant, accurate, and easy-to-cite information, they have a reason to reference it.
That creates an opportunity to earn a backlink without negotiating a placement or paying for a link.
However, publishing statistics alone does not guarantee backlinks. The topic must have demand, the information must be reliable, and the page must offer something useful to the people who need it.
Our strategy focuses on those three requirements.
The organic backlink strategy: Create statistical roundup articles
A statistical roundup brings together relevant data about a specific topic in one organized resource.
For example, a web design statistics article might cover website performance, accessibility, user experience, conversion rates, design trends, and AI adoption.
Instead of making readers search through multiple reports, the article gives them a useful collection of findings with links to the original sources.
Each statistic creates another opportunity for a writer to cite the page. A well researched article with 50 useful statistics can support claims in many different types of content.
We typically use two types of statistical articles.
1. Publish original research with exclusive findings
Original research gives your website data that other publishers cannot find in the same form elsewhere.
You can collect this data through surveys, experiments, interviews, product analysis, or your own data analysis. The method depends on your industry and the questions your audience needs answered.
For example, we published a study on what to include in ecommerce product pages.
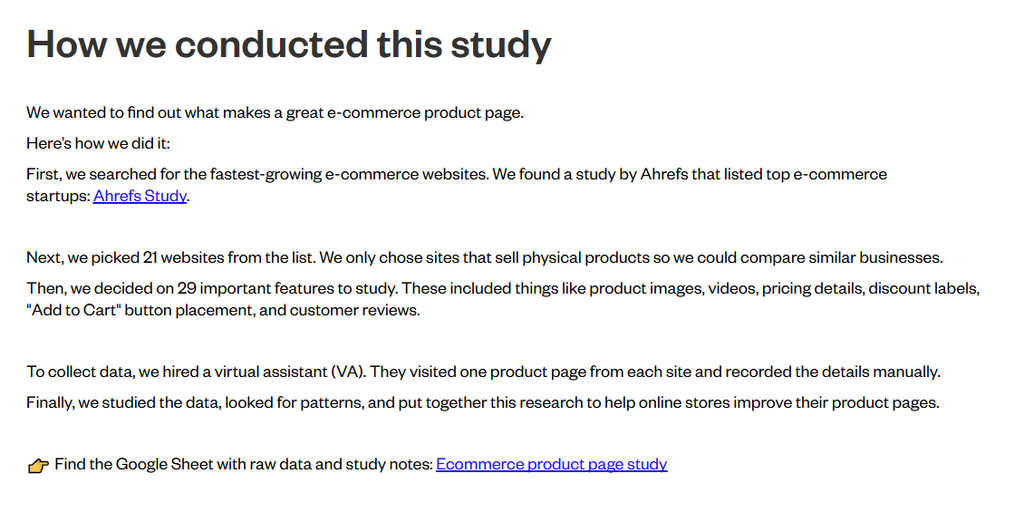
This research addresses a practical question for ecommerce businesses and website designers. Other publishers can reference its findings when writing about product page design, conversion optimization, or ecommerce user experience.
To create original research for your business, follow these steps:
- Identify a question your target audience wants answered.
- Choose a research method that can produce credible findings.
- Collect and analyze the data.
- Explain your sample, method, limitations, and results.
- Publish the findings with clear charts, tables, and explanations.
- Make the research easy for other writers to reference.
For example, a recruitment software company could survey HR managers about hiring challenges. A cybersecurity company could analyze common security issues across a defined set of websites. A financial services company could study customer preferences through a properly designed survey.
The important point is to produce findings that answer a real question. Do not create a study simply to produce a large number of statistics.
Original research usually requires more effort than compiling public data. However, it can give publishers a stronger reason to cite your website because your findings provide information they cannot obtain from another roundup.
For references, here are some of our recent original-research-based linkable asset articles:
- Which Websites Does ChatGPT Cite Most for Brand Reviews?
- LinkedIn Profile Optimization Best Practices (Data-Backed)
- What To Include in Your SaaS Pricing Page? (Original Study)
2. Statistical roundup articles based on trusted data sources
You do not always need to run a survey or conduct an experiment to create a useful statistics page.
You can also collect existing data from government agencies, research institutions, industry reports, academic studies, and trusted publications.
Our AI in Web Design Statistics page is one example of this approach. We also created remote work and HR statistics pages for Yomly.
The value comes from finding relevant information, checking it against its original source, and organizing it in a way that makes it easy to use.
Here’s how to create a statistical article that brings you high-quality organic and natural backlinks every month:
Our 9-step process for creating backlink earning content
The following process explains how we develop statistical roundup articles. It covers topic selection, research, verification, writing, structure, and maintenance.
Step 1: Choose a topic where people search for statistics
Do not start by choosing a topic simply because it interests your team. Start by finding a subject where people need data and where your business has a reason to publish content.
We look for three things:
- Citation demand: Bloggers, journalists, researchers, and industry writers regularly use statistics when discussing the topic.
- Business relevance: The topic connects to our services, products, or target audience.
- Content opportunity: Existing statistics pages lack useful data, have outdated figures, or fail to organize the information well.
For Tenet, web design statistics were a natural fit. Writers covering website design, user experience, digital products, and conversion optimization often need data to support their articles. The topic also relates directly to our services.
You can use the same approach in any industry where writers reference research and data.
How to find your topic
First, search Google for terms such as:
- [topic] statistics
- [topic] industry statistics
- [topic] trends and statistics
- [topic] research report
Open the top five results and review their content.
Ask yourself:
- Are the statistics recent enough for the topic?
- Do the pages link to reliable original sources?
- Do they cover the main questions readers have?
- Are important subtopics missing?
- Can you offer better research, clearer explanations, or more useful organization?
Next, check monthly search demand using a keyword research tool. Look at related queries and the strength of competing pages.
Search volume alone does not prove that a topic will attract backlinks. The goal is to find a subject where people search for information and where other publishers have a reason to cite your findings.
Action item: Create a shortlist of five statistics topics. For each topic, record its search demand, business relevance, competitor quality, and potential citation opportunities. Prioritize the topics that offer the strongest combination of these factors.
Step 2: Research the topic using three search methods
A single Google search rarely reveals all the useful research available on a topic.
We use three types of searches to find existing roundups, reports, and official datasets.
Search 1: Find existing statistics articles
Search for:
[topic] statistics
This reveals competing roundups and shows you which figures other publishers consider important.
Review their sources, publication dates, content structure, and missing information. Use this analysis to identify gaps rather than simply copying their lists.
Search 2: Find research reports and PDFs
Search for:
[topic] statistics filetype:pdf
This can surface research reports, whitepapers, survey results, and presentations that may not appear in the same way in a standard article search.
Open promising documents and check whether their findings apply to your topic. Record the research date and original publisher.
Search 3: Find government data
Search for:
[topic] statistics inurl:gov
This can help you discover government reports, official datasets, and public research.
Government sources are especially useful for demographic, employment, economic, education, health, and other public data. However, a government domain does not automatically make every figure suitable for your article. Check the actual report, methodology, and date.
You can also search academic databases, research institutions, trade associations, and the websites of companies that publish original studies.
Build a research library
As you research, save each useful source in a spreadsheet. Record the source URL, original publisher, research date, relevant statistic, and any notes about its limitations.
This prevents you from repeating the same research and makes it easier to verify every figure before publication.
Action item: Run all three searches for your chosen topic. Compare the results and identify sources that the leading competing articles have not covered.
Step 3: Collect up to 60 useful statistics
We use 60 statistics as a practical upper limit for a roundup. This gives us room to cover a topic in depth without making the article unnecessarily long.
The right number depends on the topic. A focused article may need fewer statistics, while a broad industry guide may support more. Quality matters more than reaching a fixed number.
When you collect more than 60 candidates, remove weak or irrelevant entries.
Our editing process prioritizes two checks.
First, review the research date.
We generally remove statistics based on research that is more than 3 years old when newer data is important and available. Check when the study collected its data, not only when a website published or updated the article.
An article updated this year may still contain figures from an older study.
Older data can remain useful for historical comparisons or topics that change slowly. Keep it when it adds value, but label its date clearly.
Second, remove statistics that do not fit the topic.
A web design statistics page should focus on website design, usability, accessibility, performance, user behavior, and related subjects. General internet usage data may not belong unless it supports a clear point.
Review each statistic and ask whether it helps the reader understand the topic or make a decision.
Action item: Build a list of candidate statistics, then remove outdated, repetitive, weakly sourced, and unrelated entries. Aim for a collection that covers the topic well rather than one that simply contains many numbers.
Step 4: Verify every statistic against its original source
This step is essential because a statistic is only as reliable as the evidence behind it.
Many articles repeat figures from other websites without checking the original research. Over time, the number may lose its context, the date may disappear, or an incorrect figure may spread across multiple pages.
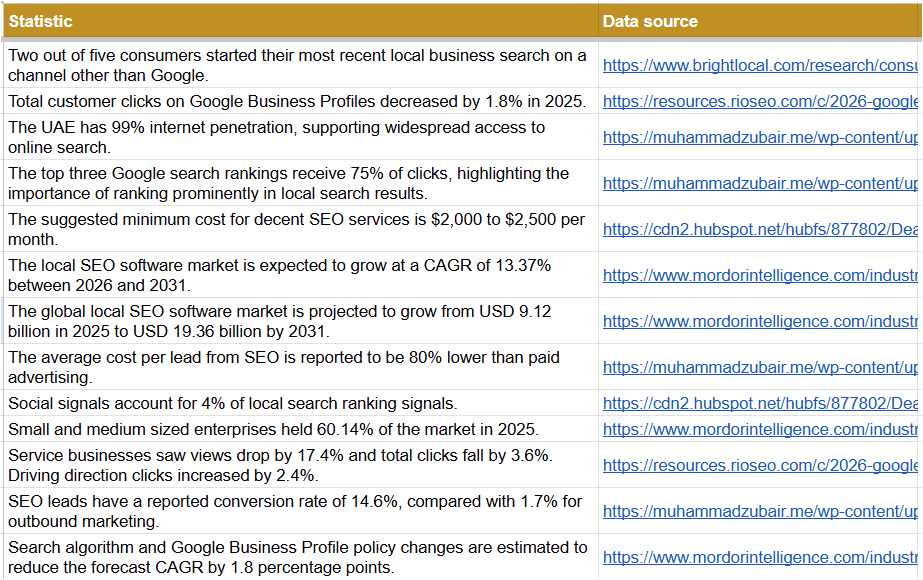
We use a simple spreadsheet to track the data.
| Statistic | Source |
| The finding, recorded with its exact meaning and value | Link to the original study, dataset, survey, or report |
You can add columns for the publication date, research period, geography, methodology, and verification status as your project grows.
Here’s a snapshot of a sheet to maintain a data library for each article:
How to find the original source
Start with the article where you found the statistic. Look for a citation, report title, study author, or source link.
Follow that trail to the original research. Open the report or dataset and confirm that the figure matches the claim.
Check these details before accepting it:
- The number matches the source.
- The study measures the same thing described in your article.
- The date and geography are clear.
- The sample and methodology support the claim.
- Any qualifications or limitations remain visible.
If you cannot find the original study, use the strongest available secondary source only when appropriate. Mark it as a secondary source in your research sheet, and do not present it as independently verified primary data.
If you cannot confirm a figure or its meaning, leave it out.
Your source spreadsheet should become the foundation for fact checking and future updates. The verified source links can also form the data sources section at the end of your published article.
Step 5: Rewrite each statistic in clear, original language
Do not copy paragraphs from research reports or competing articles. Explain each finding in your own words while preserving its meaning.
A useful statistic should make sense even when a reader sees it outside your article.
For example, a weak entry might say:
“52% work remotely.”
This does not tell readers who the statistic covers, where the data comes from, or when researchers collected it.
A stronger entry would identify the group being measured, the location or scope, the research period, and the finding.
Use a structure such as:
“According to [original source], [percentage or number] of [defined group] reported [specific finding] during [period] in [location].”
Adapt this structure to the evidence. Do not add a location, time period, or explanation unless the source supports it.
Vary the sentence structure
A page with 60 bullets that all begin with a percentage can feel repetitive. Use different sentence structures to make the content easier to read.
For example:
- “The study found that [group] experienced [finding].”
- “[Finding] affected [percentage] of [defined group], according to [source].”
- “Between [period] and [period], [metric] changed from [value] to [value].”
- “Researchers reported [finding], highlighting [implication supported by the data].”
These are writing patterns, not statistics. Replace the placeholders with verified evidence.
Keep the meaning intact
Never change the scope of a study to make a finding sound more impressive. Do not turn a correlation into a claim of causation, treat survey responses as proven behavior, or apply a result from one country to the whole world.
If the original source uses a particular definition or measurement method, preserve it where necessary.
Action item: Select five statistics from your research sheet. Write three versions of each, then choose the clearest version that preserves the original meaning and can stand alone as a citation.
Step 6: Group the statistics into clear categories
A long list of statistics is difficult to navigate. Readers should be able to find the information they need without scanning every entry.
We group statistics into five to nine relevant categories, depending on the topic.
For example, an AI in web design statistics article could include sections on:
- H1 Title — “[Topic] Statistics” + year
- Featured image — branded cover
- Introduction — 2–3 short paragraphs
- Methodology note — under 60 words + last updated date
- Table of contents — jump links to categories
- TL;DR “at a glance” — 10 best statistics at a glance
- Category sections — themed H2s with descriptions
- Chart per category — one visual per section
- Note / CTA box — internal link to your offer
- Repeat block — categories 2–6 follow the same pattern
- Final words — conclusion with internal links
- FAQs — 5 questions as H3s
- Data sources — raw URLs of original sources
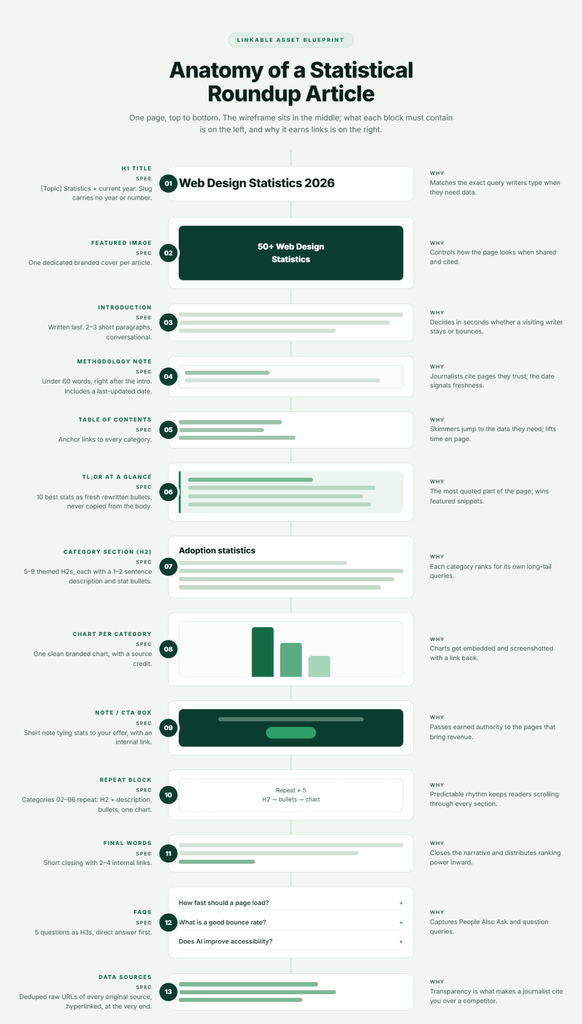
Each section should have a clear heading and a short introduction explaining what the reader will find there.
Categories help readers move directly to relevant information. They also allow your article to cover related search queries naturally.
For example, a dedicated section on website accessibility statistics can help readers find relevant figures without reading the full article.
How to organize your research
Review your spreadsheet and group related statistics together. Give each group a descriptive heading that matches the subject of the data.
As a starting point, a group with fewer than four statistics may fit better under a broader heading. A group with more than 12 may need to be divided into smaller themes. These are flexible guidelines, not strict rules.
Avoid creating sections simply to include more keywords. Every category should help readers understand the topic.
Action item: Organize your verified statistics into clear groups. Review the headings to ensure that each section has a distinct purpose and that readers can find important information quickly.
Step 7: Add a TL;DR section with the 10 strongest findings
Many readers scan an article before deciding whether to read it in full. A concise summary helps them understand the main findings quickly.
We select the 10 most useful statistics for a TL;DR section near the beginning of the article.
Look for findings that are surprising, important, recent, or useful for a common question. Prioritize statistics that can support a clear statement in another article.
Each bullet should include enough context to make sense on its own. Keep the wording direct and link to the original source when practical.
Do not choose statistics only because they contain large percentages or dramatic numbers. A less dramatic finding may be more useful if it answers a common question or offers a reliable comparison.
Also, do not copy the first 10 entries from the main article. Select the strongest findings from across all categories.
How to create your summary
- Review every category.
- Mark the statistics with the clearest practical value.
- Shortlist 12 to 15 candidates.
- Remove repetitive findings.
- Choose the strongest 10.
- Rewrite each bullet so it works independently.
A concise summary improves the reader experience and makes your research easier to scan. It may also help search engines understand the page, although a TL;DR section does not guarantee a featured snippet or any specific search result.
Action item: Write the summary after you finish the research and categorization. This ensures that the opening section reflects the strongest evidence in the article.
Step 8: Write the introduction, methodology, and conclusion
Once the research and structure are complete, you know what the article actually covers. You can then write an introduction and conclusion that reflect the findings rather than making promises the data cannot support.
Write a focused introduction
Explain what the article covers, who will benefit from it, and why the information matters.
Avoid long introductions that delay the data. Readers who search for statistics usually want to reach the findings quickly.
Add a short methodology note
A methodology note explains how you collected and checked the information. We keep ours under 60 words where possible.
Your note should cover three points:
- Which types of sources you reviewed.
- How you verified the statistics.
- When you last updated the article.
For example:
“We reviewed research reports, industry studies, and official datasets relevant to [topic]. We checked each statistic against its original source where available and retained the context needed to interpret the findings. This article was last reviewed on [date].”
Use the conclusion to connect the research to your business
Statistical articles can attract high quality editorial backlinks passively every month. Instead of letting all that link equity stay on the statistics page, use internal links to direct readers and search engines to your important commercial pages.
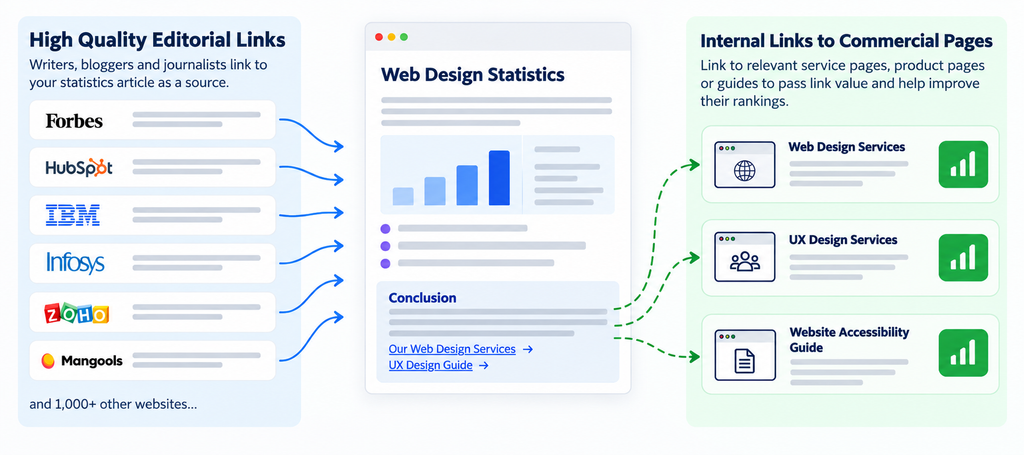
For example, if your web design statistics page earns links from industry publications, add relevant internal links to your web design service page, UX design services, or related guides. Similarly, an HR statistics article can link to relevant workforce management services or product pages.
These internal links help search engines discover your commercial pages and can pass PageRank through your website. This may help improve the ranking potential of those pages over time, although results depend on several factors and are not guaranteed.
Keep the links relevant and useful. Place them where they help readers take the next step, rather than adding sales links that feel out of place. You can also link to important commercial pages from relevant sections throughout the article, not just the conclusion.
Step 9: Publish, update, and maintain the article
Publishing the article is not the final step. Statistics become outdated, sources change, and new research becomes available.
We revisit our statistical roundups to replace old figures where better data exists, add relevant findings, and update the last reviewed date.
This helps keep the page useful for readers who need current information.
Build a refresh schedule
Review your article based on how quickly the topic changes.
- For fast-moving subjects such as AI, software, and digital marketing, quarterly reviews may make sense. For slower-moving subjects, a review every six to twelve months may be enough.
During each review:
- Check whether new studies or official reports have appeared.
- Verify that existing source links still work.
- Recheck figures that may have changed.
- Remove or label outdated statistics.
- Add new findings when they improve the article.
- Update the methodology and review date to reflect the work completed.
- Check internal links and the page’s search performance.
Do not change the publication date simply to make an unchanged article look fresh. Update the page when you have made meaningful improvements.
You can also monitor new backlinks to understand which statistics attract citations. If writers repeatedly reference one section, make sure that section remains accurate and easy to use.
Action item: Choose one existing data driven article on your website. Review its sources, update the figures where needed, and track its search performance and new referring domains over the following 60 days. Treat this as a measurement period, not a guarantee of ranking improvements.
Why statistical roundup articles can earn backlinks over time
Our approach works because it gives other publishers something useful to reference.
There are four main reasons this format can attract links.
1. Writers need evidence to support their claims.
A writer discussing website performance may need a reliable figure on page speed. A journalist covering AI may need adoption data. A marketer explaining consumer behavior may need research to support a recommendation.
When your page provides the relevant evidence and clearly identifies the source, it gives the writer a useful reference.
2. One article can serve several related search needs.
A well organized roundup may cover multiple subtopics. Each section can answer a different question and help readers find the information they need.
This creates more opportunities for the page to appear in relevant searches. Rankings still depend on competition, relevance, quality, and other factors.
3. Useful data can attract links without individual outreach.
When a publisher finds your page while researching an article, they may cite it without you contacting them.
This is the main advantage of our approach. Instead of relying entirely on direct outreach, we create resources that can attract citations organically.
However, no article can guarantee passive backlinks. Topic demand, source quality, search visibility, and the usefulness of the content all influence the outcome.
4. Regular updates keep the resource useful.
Writers are more likely to use data that matches the period and question they are covering. Updating the article gives you a chance to replace weak figures, add new research, and correct broken source links.
A well maintained article can remain useful long after its original publication.
How much did this backlink strategy cost?
Our direct spending on buying backlinks was $0 for Tenet.
That does not mean the work had no cost. Research, writing, editing, fact checking, design, and maintenance all require time and resources.
The value of the strategy comes from turning that work into an asset that can continue attracting citations.
Based on our estimate of comparable paid placements, more than 4,700 backlinks would represent at least $50,000 in equivalent market value.
This is an estimate, not a claim that every backlink has the same price or SEO value. A link from a highly relevant publication may have a different value from a link on a less relevant page. Some placements may not be available for purchase at all.
It is also important to distinguish backlinks from referring domains. One website can link to your content several times, creating multiple backlinks but only one referring domain.
For a clear assessment, track both metrics and review the actual linking pages.
How to measure the results of your own campaign
Do not measure success only by the total number of natural backlinks. Track whether your content earns relevant links and supports your wider SEO goals.
Use a spreadsheet or SEO platform to record the following metrics.
| Metric | What it tells you |
| Total backlinks | The number of links pointing to the page or group of pages |
| Referring domains | The number of unique websites linking to your content |
| Relevant referring domains | How closely the linking websites relate to your topic or audience |
| New backlinks per month | How quickly your content attracts new links |
| Organic search traffic | Whether people find the page through search |
| Keyword visibility | Whether the page gains visibility for relevant searches |
| Assisted conversions | Whether visitors who discover the resource later take a valuable action |
Review the actual linking pages when possible. Check whether the link is live, whether it points to the intended URL, and whether the surrounding content makes sense.
Use a consistent reporting period so you can compare results over time. Keep in mind that changes in rankings or traffic may have several causes, so do not attribute every improvement to backlinks alone.
Final Words
You do not need a large link building budget to start earning organic backlinks. You need a topic that people care about, trustworthy information, and content that other publishers can use.
Start with one statistics page that connects directly to your business. Research the topic thoroughly, verify the sources, present the findings clearly, and maintain the resource after publication.
At ASAD, an AI SEO agency in Dubai, we apply this principle to help brands build useful content and improve their visibility across search and AI-driven discovery platforms. Tenet is our parent company, and the backlink results described in this article come from Tenet’s website.
Our experience shows that a focused content strategy can create a lasting source of organic backlinks. The key is to publish information worth citing rather than treating every backlink as a separate transaction.
If your business wants to build a stronger organic search presence through useful content, relevant citations, and a clear SEO strategy, request a free AI visibility proposal.